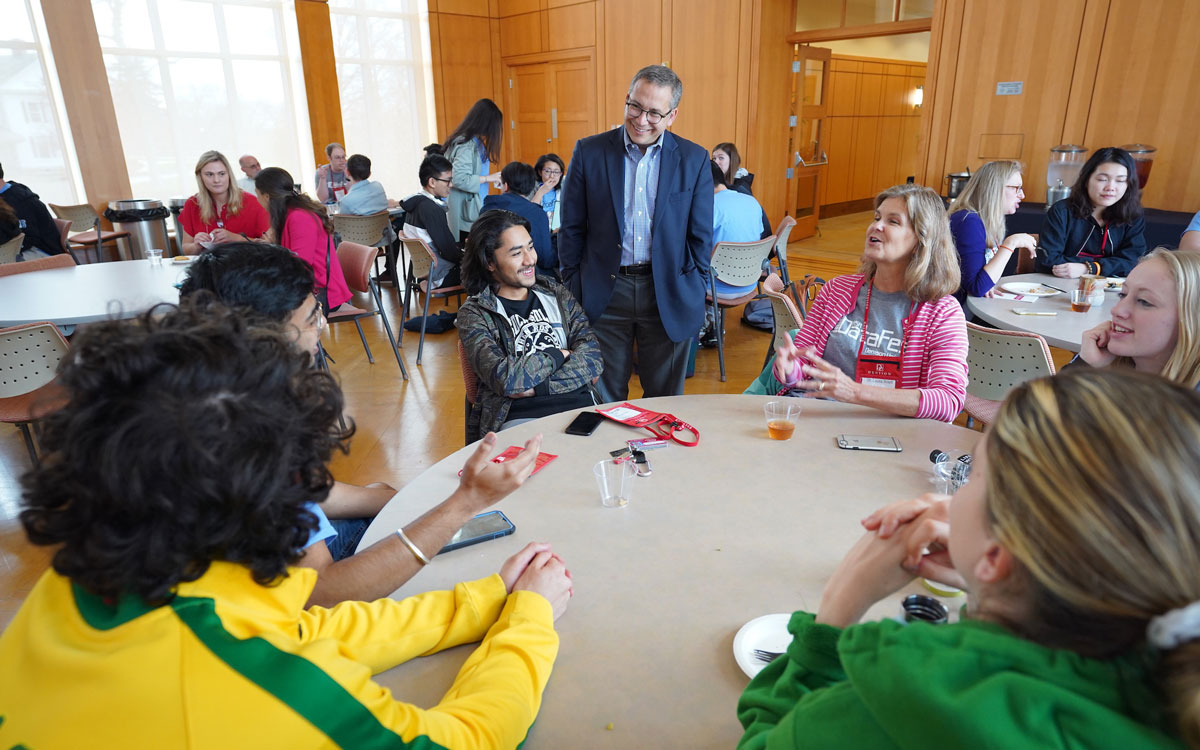
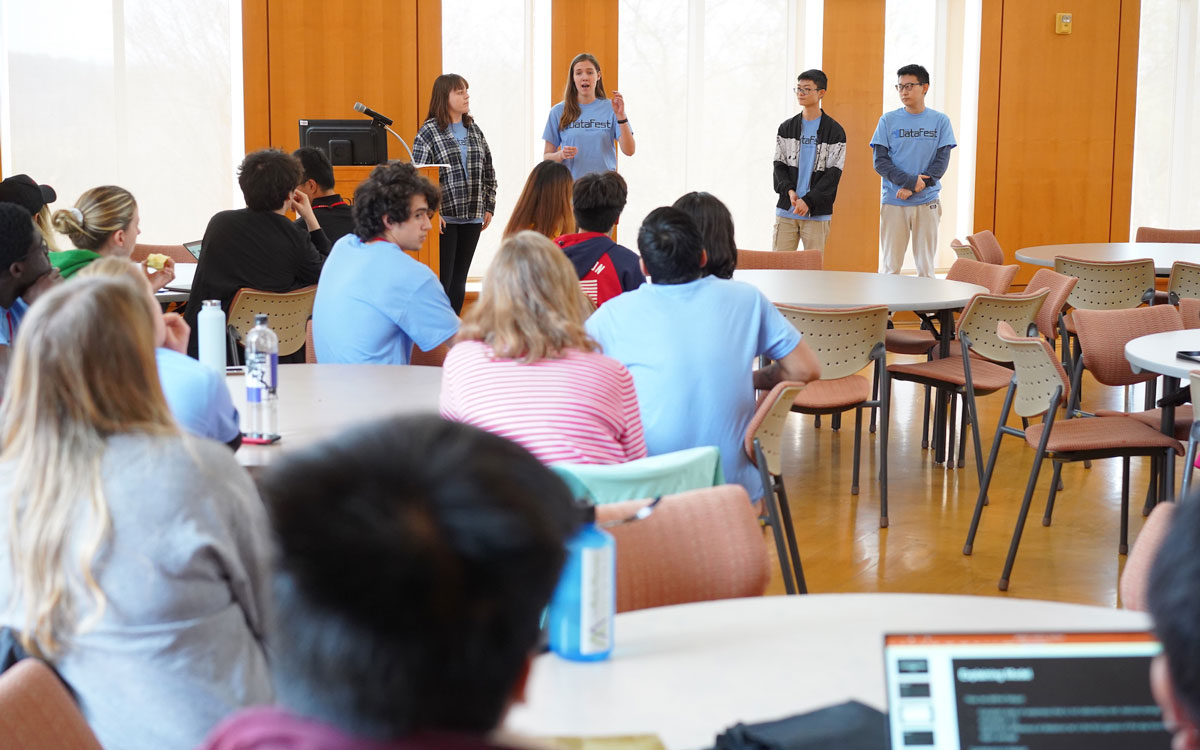
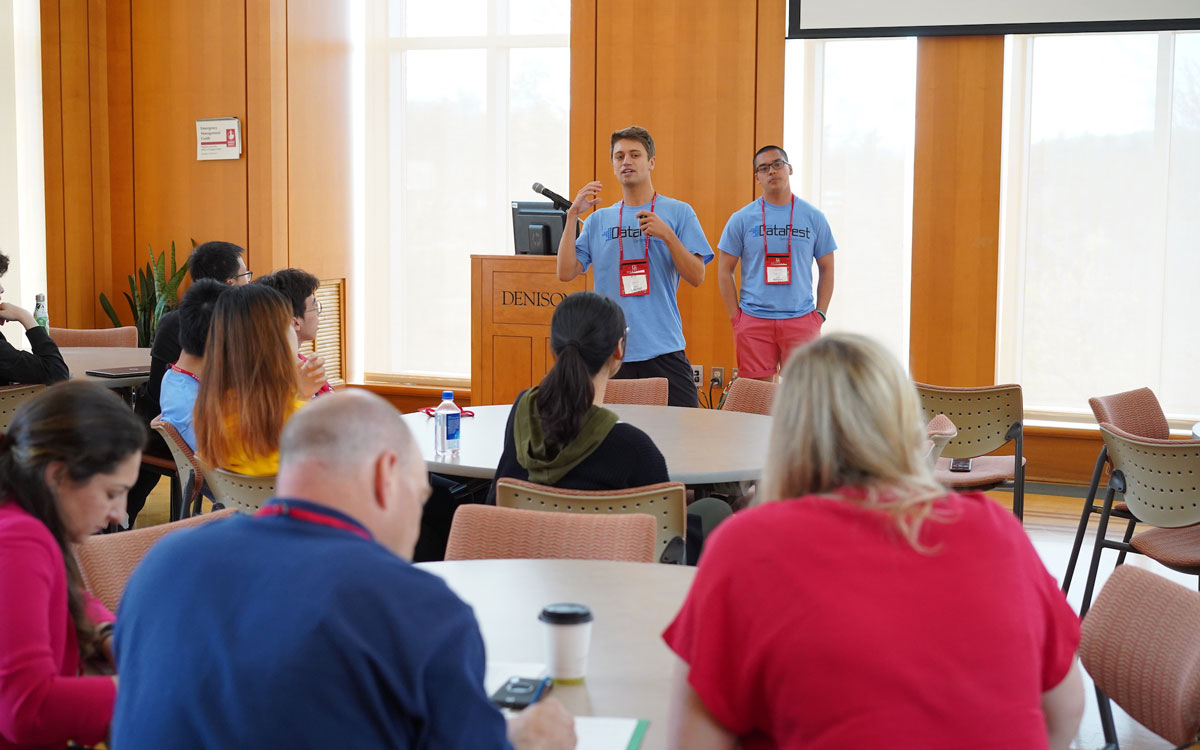
A secret data set, a weekend of hacking, mining and modeling data with your team, and the opportunity to present your work to professionals in the industry — that’s DataFest, an annual event that takes place each year on college campuses all over the country, including Denison.
Data analysis — like in the book and movie “Moneyball” — is applied across a whole spectrum of businesses, organizations, and activities. During DataFest, students work with a real data set to figure out how to define and organize its most useful information.
Michael Brady, associate director of the Data Analytics Program, says, “A surprise data set and project like this is a really great test of students’ ability to learn about a topic in real time, flex their growing analytical toolkit, and showcase their ability to distill technical information into actionable suggestions to a non-technical audience.”
It’s also a terrific opportunity to present findings to judges who work in the world of data, get critical feedback, and build a network for that future career. In fact, nearly 30 professionals with analytics experience from the Columbus region volunteered time over the weekend to consult with students as they worked on the project.
“DataFest is an excellent way for students to jump into analyzing real-world data,” says Lauren Burke, a judge and consultant for the event. “The data and problems are real, the topics are relevant to students and the process promotes creative problem-solving.”
“As a judge, I enjoyed seeing the different approaches each team took to working through and presenting their findings. The project encourages students to think about each aspect of the analytical process, where the goal isn’t to deliver a singular insight, solution, or visualization - it’s about telling a compelling story.”
“DataFest is an excellent way for students to jump into analyzing real-world data.”
The Canadian National Women’s Rugby Team donated their numbers to the 2019 DataFest contest with a goal of finding a better understanding of player fatigue.
The Canadian team shared a wide variety of player data — including strength conditioning, biomechanics, performance analysis, physiology, nutrition, and mental performance. Internal factors were measured through questionnaires. External factors, like heart rates and blood oxygen levels, were determined through physical data.
Eleven teams of forty students from different academic disciplines competed in the contest. They learned how to work under time pressure, and to work together as a group, learning each other’s strengths and weaknesses and sharing the work load. And they also learned the importance of content area knowledge. For example, some groups already knew about rugby, but many had to learn about the sport from the ground up.
“I loved working with data without worrying about my grade or GPA,” says data analytics and communication double major Olivia Lueck ’22.
Professional judges for the event were Lauren Burke, data scientist with Abercrombie & Fitch and director of operations of Women in Analytics; Dave Cherry, principal and executive strategy advisor with Cherry Advisory, LLC; and Asuman Turkmen, associate professor of statistics with The Ohio State University, Newark.
Cherry sums up the entire weekend, “I was very impressed with the overall quality of the analytics capabilities that the teams demonstrated. They brought creative approaches to solve a common problem and in doing so, showed outstanding visualizations and strong command of concepts. I think that the analytics program at Denison and the future of the students involved is definitely trending upward!”
“DataFest weekend was the best weekend of my LIFE,” says “Jessy” Jiahui Niu ’22, who is double-majoring in data analytics with a concentration in economics and mathematics. “I had so much fun.”
A number of awards were given:
Best Use of Secondary Data is awarded to the team with the most creative and informative use of additional data beyond the provided data set.
The winning team: MS LiT (Jay Dickson ‘20, Sarah Li, Sueshin Moon ’22, and Mengcen Yang ’22)
Best Interdisciplinary Content is awarded to the team with the best use of knowledge from domain area of the data.
The winning team: 95% Confident (Bridget DiPalermo ‘21, Lueck, Kobi Ocran ‘21)
Best Visualization is awarded to the team with the best, most polished, informative, and creative visual.
The winning team: DataVizards (Ming Chen’21, Niu, Jingyi Wang ‘21, Ruijia Zhang ‘20)
Best In Show is awarded to the team with the most impressive and complete contribution in terms of statistics, approach, visuals, and oral delivery.
The winning team: The Four Horsemen (Logan Mallory ‘20, Quang Nguyen ’21)
Most Valuable Participant is awarded to the individual who went above and beyond to help not only their team, but other teams, and the atmosphere of the whole weekend.
The winner: Jingyi Wang ‘21


